
Mean, median, mode, and range
I can find the mean, median, mode, and range to interpret data.


8,000 schools use Gynzy
92,000 teachers use Gynzy
1,600,000 students use Gynzy
General
In this lesson, students calculate the mean, median, and range of a data set. They will also identify the mode and outlier and be able to define each of these terms. Students will understand the importance of this information.
Standards
CCSS.MATH.CONTENT.6.SP.B.5.C
Learning Objective
Students will be able to find the mean, median, mode, and range of a data set
Introduction
Begin by explaining the importance of interpreting data. For example, you can keep track of scores in a soccer game. Then define the terms, “mean,” “median,” “mode,” and “data set.”
Instruction
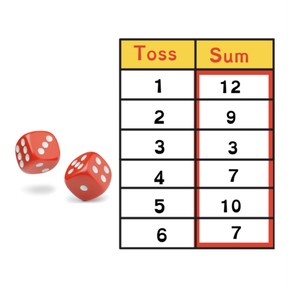
Show students the data set which shows the sum of two dice tossed six times. First, explain how to calculate the mean. Add all of the numbers and then divide the amount of numbers in the data set by that sum. Have students practice with the example on the board. Next, explain how to find the median. First arrange the numbers from least to greatest then circle the middle number. If there are two middle numbers, add the two numbers and divide by two. Then explain how to find the mode. Tell students that the mode is the number that appears most often. The “mo” at the start of “mode” and “most” can help them remember this. After this, explain how to find the range. Sometimes, the mean or average does not always accurately reflect the data. In these cases, the range is important to consider. Finally, explain what an outlier is and the significance of this number. Students practice finding the mean, median, and mode for several data sets.
Quiz
Students respond to ten multiple-choice questions as well as fill-in responses in which students calculate the mean, median, mode, and range.
Closing
Students create a survey for their classmates and gather the information. Then have students find the mean, median, mode, and range. Is there an outlier? What can they determine from this data?
The online teaching platform for interactive whiteboards and displays in schools
Save time building lessons
Manage the classroom more efficiently
Increase student engagement
Discover more!


About Gynzy
Gynzy is an online teaching platform for interactive whiteboards and displays in schools.
With a focus on elementary education, Gynzy’s Whiteboard, digital tools, and activities make it easy for teachers to save time building lessons, increase student engagement, and make classroom management more efficient.